Colloquy_Banner_Dec.png

graph-conceptual.jpgSixty percent of ATS member schools report increased or stable enrollment
 By Chris A. Meinzer 

Sixty percent of ATS member schools in the United States grew from fall 2025 to fall 2026, and overall enrollment grew by two percent to about 77,100 students. This is according to 278 schools (98 percent) having reported enrollment data as of November 15, 2026. Six out of 10 have shown stable or increasing enrollment from fall 2025 to fall 2026, representing a three-year-over-year positive trend. Fifty-six percent of Canadian ATS member schools grew from fall 2025 to fall 2026, but overall enrollment declined by five percent to around 5,500 students.

Enrollment totals and degree categories

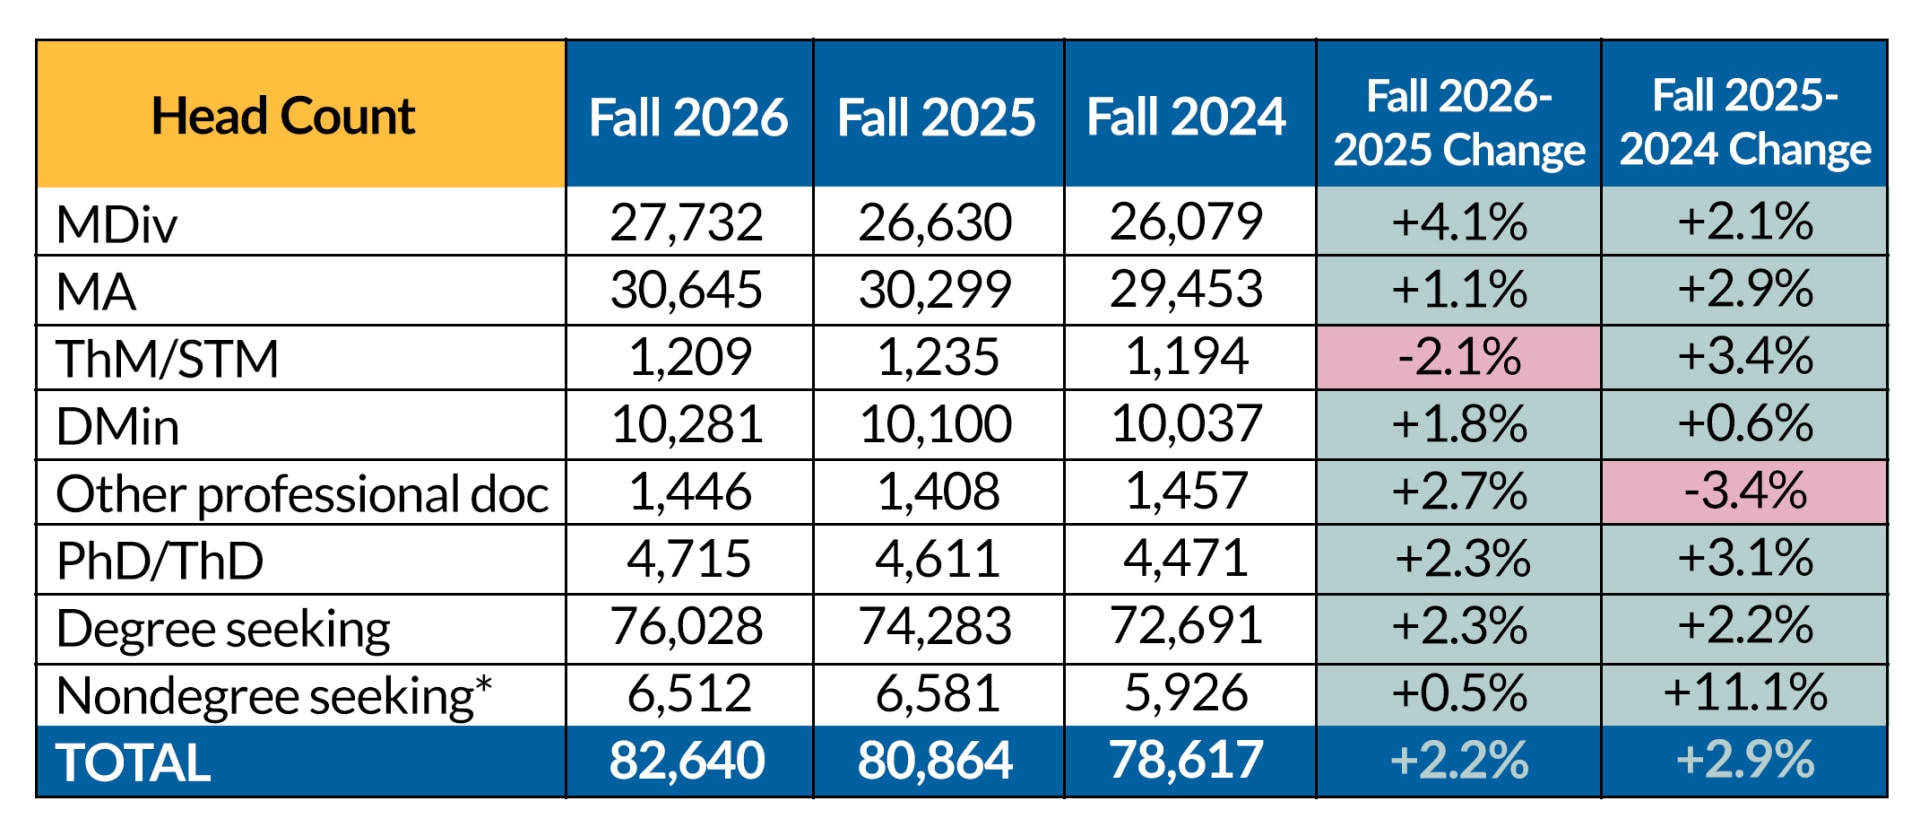
Assuming enrollment for the six schools remaining to report will match what was reported in fall 2025, enrollment projections are as follows:

  • The fall 2026 head count enrollment is expected to exceed 82,600 students, with an increase of 2.2 percent in total enrollment.
  • Enrollment within degree categories is showing increases from fall 2025 to fall 2026 for all except the ThM/STM categories.
  • The two degree categories that have shown some year-over-year decline in the last two years (ThM/STM and Other Professional Doctorate) are essentially flat from fall 2024 to fall 2026.
  • The median ATS school is 129 students, and the average ATS school is 291 students in fall 2026.
Meinzer_Chart-A.jpg

Enrollment by country

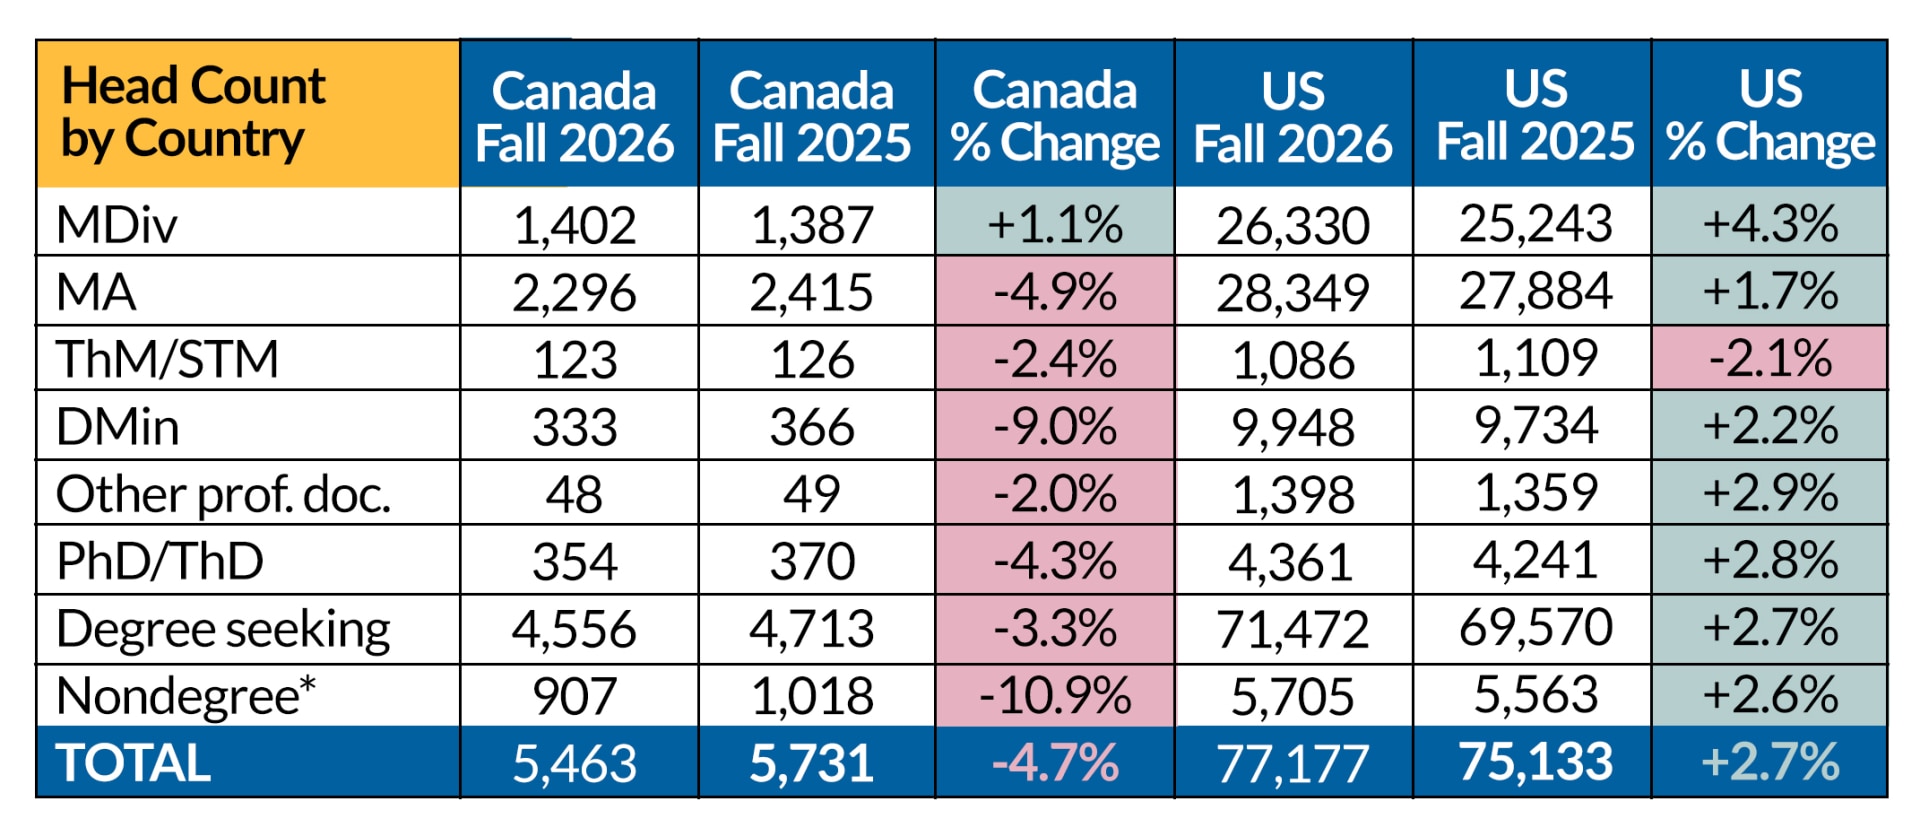
Historically, Canadian schools have had different enrollment patterns than the US schools. Additionally, Canadian schools have tended to be smaller. These realities continued in fall 2026:

  • The median Canadian school had 114 students, and the average Canadian school had 152, with a range of 844 students to fewer than 10.
  • In the United States, the median school had 132 students, and the average had 312, with a range of more than 6,600 students to fewer than 10.

Country enrollment by degree category is also instructive:

  • In Canada, every degree category other than MDiv experienced enrollment declines from fall 2025 to fall 2026, with some substantial declines within categories.
  • The United States saw steady growth among all degree categories, except for ThM/STM.

Given the relatively larger numbers in the United States, the changes in degree category in the US drive the overall enrollment numbers for all ATS member schools.

Meinzer_Chart-B.jpg

Enrollment by ecclesial family

ATS also attends to enrollment patterns within member schools across ecclesial family:

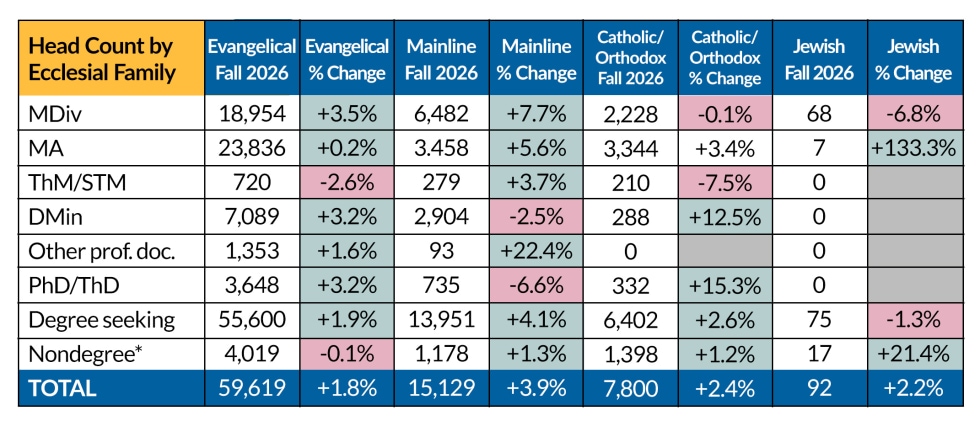
  • Evangelical schools grew by 1.8 percent from fall 2025 to fall 2026, with growth across all degree categories but ThM/STM.
  • Mainline schools grew the most, with an overall increase of nearly four percent, and significant growth across masters’ level degrees.
  • Catholic/Orthodox schools grew 2.4 percent, with growth in all but the MDiv category, which was flat, and the ThM/STM.

The continued growth across ATS member schools in head count enrollment continues to be broad-based and substantial.

Meinzer_Chart-E.jpg

Enrollment across the decade

Another interesting enrollment perspective can be found looking at the roster of schools that were ATS members for the entire last decade.

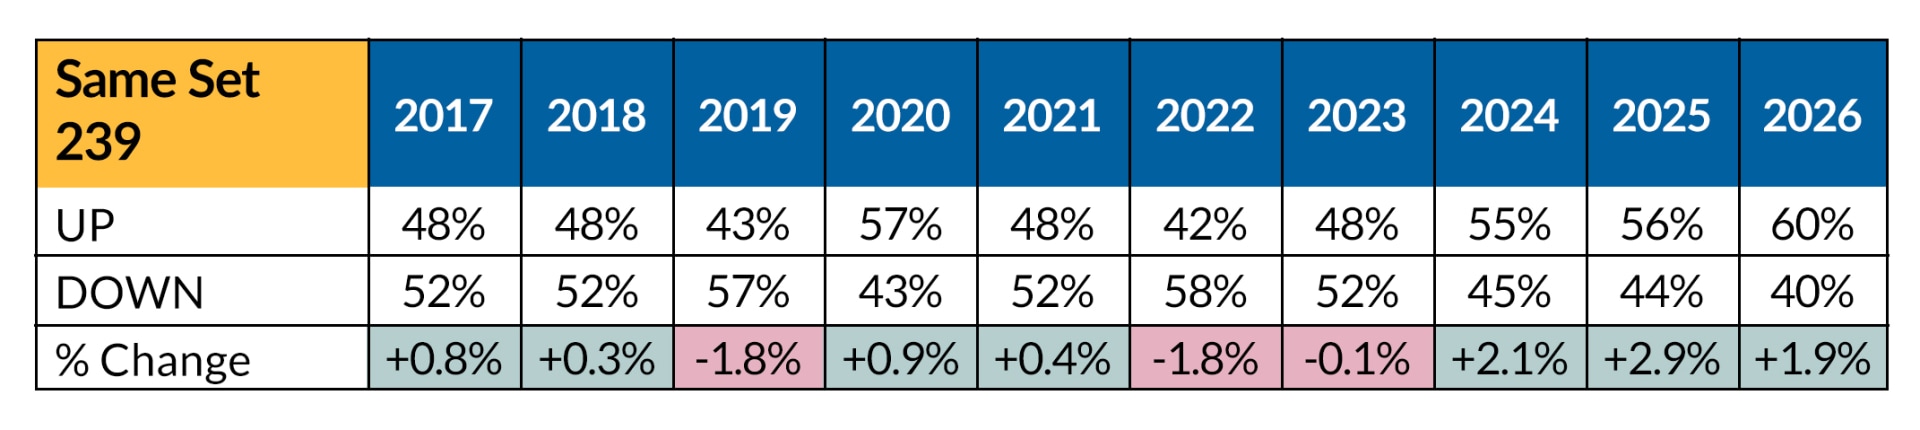
Two-hundred thirty-nine schools were continuously part of ATS from fall 2017 to fall 2026, with this timeframe including the impact of the COVID-19 pandemic.

From 2017 to 2023, more schools declined than grew for all years except 2020 during the pandemic. This pattern of more schools declining than growing had been in place since 2007. But the last three years have reversed, with more schools growing than declining. This broad recovery has led these same set of 239 schools to grow by two to three percent in the last three years.

The following chart shows the percentage of ATS schools that grew year-over-year during the decade versus those that declined:

Meinzer_Chart-C.jpg

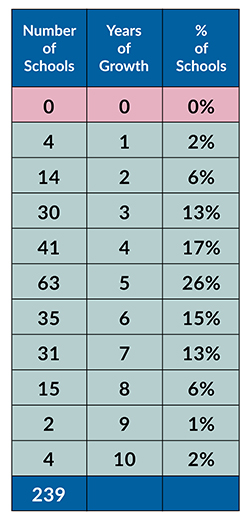
Meinzer_Chart-D-0001.jpgA notable analysis can be made when seeing how many years each of these 239 schools grew within the decade. The chart below shows how many schools experienced a particular number of years of growth over these 10 years. For example:

  • No schools showed zero years of growth.

  • Four schools showed 10 years of growth over the decade.

  • About 80 percent of the schools had growth in between three and seven years.

  • Just under 10 percent had one or two years of growth.

  • Just under 10 percent reported eight to 10 years of growth.

  • About one-quarter of the schools had five years of growth over the decade, with the other five years denoting a period of decline.

What next?

Twelve ATS member schools had enrollment growth in each of the last five years, between fall 2022 and fall 2026. ATS staff have reached out to these 12 schools to ask some fundamental questions about their enrollment patterns and approaches during this timeframe. In a future Colloquy article, ATS will assess the responses from these schools to see if something can be discerned and applied for the benefit of the broader membership.

If your institution has been experiencing growth and you want to share your story, feel free to contact me at meinzer@ats.edu. There is much to celebrate, and there is great benefit in the potential learning that can be shared among the ATS membership.


Chris A. Meinzer     
     Chris A. Meinzer is senior director and COO
     at The Association of Theological Schools
     in Pittsburgh, Pennsylvania.

© 2026 The Association of Theological Schools, All Rights Reserved
Website by Morweb.org