 What Graduating Student Questionnaire data can contribute to formation assessment
By Christopher M. The
Access a downloadable PDF version of this article.
Graduation surveys usually help schools look back. A peer-reviewed study of the ATS Graduating Student Questionnaire
(GSQ) suggests that familiar questions may also offer useful building blocks for thinking about formation assessment, while a later cohort provides a useful check that the same
broad patterns appear again.
Your school may already review graduates' answers about prayer, vocational clarity, social justice, and working across difference. The more difficult question is how those answers relate to
one another—and whether they can inform assessment while there is still time to respond. This article does not propose a universal measure of formation. It asks what schools might learn
from research showing that existing GSQ responses can be read together, and what possibilities that creates for local assessment.
A peer-reviewed study recently published in the Review of Religious Research provides the empirical starting
point. A follow-up analysis of the class of 2026 then asks whether the broad patterns appear again in the most-recent graduating cohort. Together, the two analyses set up the practical
question at the center of this article: what could schools do with formation-related evidence already embedded in the GSQ?
More than one dimension of formation
The study authors examined responses from 5,528 graduates at 151 North American theological schools in 2023–24. They analyzed 36 GSQ items about perceived personal growth and skill
development, alongside 16 items about educational experience and well-being (see Data and Methods). Rather than treating formation as one undifferentiated outcome, the study asked how religious/spiritual formation, engagement across difference, and other
dimensions relate to one another and to students' well-being.
The formation questions supported five more specific dimensions alongside a general dimension: social justice commitment, religiousness/spirituality, intercultural
competence, self-identity, and interdisciplinary integration. Self-identity included vocational clarity, self-confidence, and self-knowledge; interdisciplinary
integration included science, ecological concerns, and Christian philosophy. These measures reflect students’ perceptions of their education, not direct observations of spiritual
maturity.
Two types of findings matter here: formational dimensions and response profiles. Whereas the dimensions describe what was measured, researchers also identified five broader
response profiles—recurring combinations across those dimensions—labeled Languishing, Faltering, Struggling, Managing, and Thriving.
These labels are shorthand for statistical patterns, not fixed types of students.
The middle profiles show why this distinction matters. The group labeled Faltering reported relatively stronger religious/spiritual formation but weaker social justice commitment and
intercultural competence, while Struggling showed nearly the reverse. Although the two groups reported similar overall well-being, the pattern underneath differed: Faltering
reported stronger religious/spiritual well-being, while Struggling reported stronger social well-being (see Table 1).
The practical point is not the labels themselves. It is that a single, overall formation score can conceal meaningfully different combinations of strengths and difficulties. The study also
cautions against treating these profiles as fixed types of theological students (see Discussion). That raises a straightforward question: would the broad structure appear again in a later graduating cohort?
A later cohort checks the pattern
The latest (2025–26) GSQ Total School Profile report
describes the class of 2026: 5,689 graduates across 141 participating schools. For the follow-up analysis prepared for this article, the newer responses were analyzed afresh rather than
assigned to the earlier profiles. A comparable five-profile solution emerged again, with much the same combinations of relative strengths and weaknesses.
The original study provides the peer-reviewed evidence, while the more recent analysis provides a later-cohort check: the same broad structure appears again. Figure 1 below shows that
estimated profile shares are close across cohorts for most groups, while Figure 2 at the end shows that the relative pattern across the five formation dimensions remains highly recognizable.
The practical value is continuity, not a claim that formation improved across theological education.
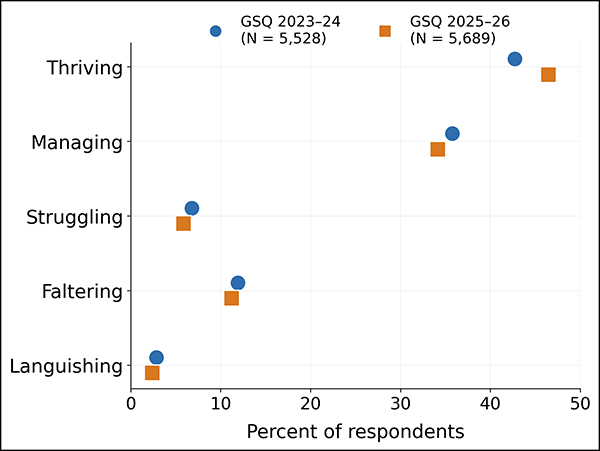
Figure 1. Estimated profile shares in two graduating cohorts
Each row compares the estimated share associated with one response profile. Blue circles indicate the 2023–24 cohort; orange squares indicate the 2025–26 cohort.
Closer points indicate more similar shares across cohorts. The cohorts contain different respondents, so differences do not represent individual change over time.
Putting GSQ findings to work
Each ATS member school owns its assessment strategy and the responsibility to demonstrate "quality assurance for various publics" (from Preamble to the Standards of Accreditation). It is important to choose evaluative methods that align with your school's purpose,
theology, and capacities. Among the many approaches ATS schools take, the GSQ offers another resource to support
evaluation, not as a replacement for institutional judgment, but as a complement to an assessment strategy that is yours. That said, here are some suggestions to consider.
1. Start where you are—the community you comprise, the data you collect. Colleagues involved in assessment might gather periodically to examine related concerns
together. This collective effort extends to the kinds of questions you—and other ATS member schools—are asking. For the data you have, are you looking across the responses you
collect? Regarding interpersonal competencies, for example, the GSQ asks graduates about a range of items, including empathy for those experiencing poverty or oppression, insight into others'
troubles, and social justice concern.
Two things are true at once: looking across related items may be more informative than treating each answer in isolation, while certain questionnaire items may be most useful for their
singular purpose. Another approach for smaller programs is to review several, comparable graduating cohorts together while keeping response counts visible, as this may offer a steadier
picture than any single-year cohort. These options assume your data collection and analysis practices are consistent enough to allow you to pool data across cohorts and to incorporate other
resources.
2. Connect the measures to your school's purposes. Which dimensions of student learning and formation offer useful evidence for your institution's formation outcomes, and
which leave gaps? Suppose students consistently report difficulty integrating their learning across disciplines. Faculty could examine that pattern alongside planning more integrative
assignments, while field education colleagues gather more robust feedback. If the additional inputs suggest similar difficulties, then a school might reconsider how coursework and supervised
practice connect, when to make an adjustment, and why revisiting the evidence is meaningful.
To be certain, surveys like the GSQ have limitations, and a school relying on them alone may wish to reconsider its evaluative strategy. Arguably, the best use of survey data is to start an
inquiry: What can we measure this way? What might explain what we are seeing? Are there other ways of knowing? The answer to that last question is yes, and the study’s
authors call for qualitative evidence to deepen interpretation (see RRR, Practical Implications). The meaning drawn from these
assessments across disciplines connects tools to purpose and mission to identity.
3. Consider local adaptations at certain checkpoints. The study’s authors also suggest considering these items at midpoints between matriculation and completion. To do
so, a school might identify a relevant group of questions and explore whether asking (a version of) them at a program milestone would shed light on their educational experiences while there
is still time to respond.
Before incorporating or adapting GSQ items locally or at midpoints, consider discussing appropriate use with ATS Student Data
Services. Questions designed to look back over a program at completion may need attention to wording and timing when asked earlier. A pilot could test students' understanding and compare
responses with reflections, portfolios, or supervisory feedback. Suffice it to say, repeating questions to the same student does not, by itself, establish a valid measure of developmental
change.
4. Ownership does not need to mean working alone. Your colleagues at other institutions may help you compare approaches, interpret an unexpected pattern, or collaborate on a
manageable pilot. ATS offers support for developing member-driven relationships. In particular, the ATS Formation
Repository gathers research, tools, and institutional examples; the ATS Assessment Coordinators resource page
includes formation-assessment case studies and a practical evaluation guide; and the ATS Resource
Library page on grant initiative-related assessment ties multilevel evaluation to programmatic impact. These ATS-curated options sit alongside many other resources.
Which formation outcome could your school better understand with evidence already in hand—and what educational decision could that understanding inform? Continue the conversation with
colleagues on Engage ATS, or contact ATS Student Data Services at Qmail@ats.edu.
Editor's Note: The full research article by Peter J. Jankowski, Steven J. Sandage, David C. Wang, Christopher The, and Deborah H. C. Gin—available now as an open
access OnlineFirst article via DOI: 10.1177/0034673X261477782—will appear in a future printed
issue of the Review of Religious Research journal. The follow-up analysis underlying Figures 1 and 2 is a separate
exploration; it does not repeat every analysis from the original study and has not undergone independent peer review.
Supplemental illustration
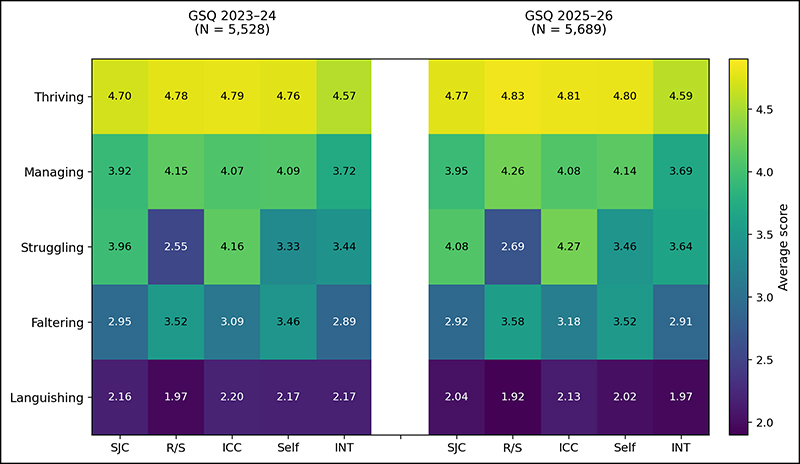
Figure 2. Formation scores within comparable response profiles
Read each row across the two cohorts to compare its pattern of scores. Rows are ordered from higher- to lower-scoring profiles for orientation. Colors and numbers represent
estimated average scores on a 1-5 scale (see GSQ-E sample for scale anchors). The horizontal-axis abbreviations are
SJC, social justice commitment; R/S, religiousness/spirituality; ICC, intercultural competence; Self, self-identity; and
INT, interdisciplinary integration.

Christopher M. The is director of
student data and research at
The Association of Theological Schools
in Pittsburgh, Pennsylvania.